Why healthcare cost distributions require a edge case focsed healtcare market.

Healthcare is a very hot topic these days. Regardless of how you feel about the topic, I feel it’s important to understand which are the critical statistics and how they can be visualized.

There are things about healthcare that make it very different than other markets such as food or cars or houses.

COST DISTRIBUTION
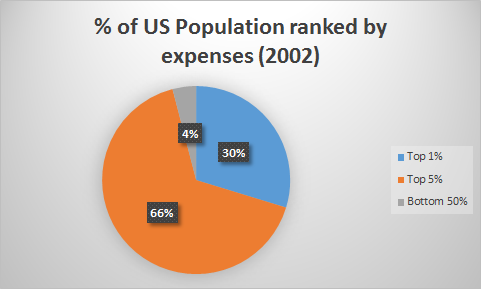
I think the most remarkable and critical element of the healthcare “market” is that the costs are INCREDIBLY concentrated.

Essentially 1% of people generate 30% of all medical costs and the bottom half of the population is responsible for only 4% of health spending.
While this is from 2002, the data is fairly consistent going back many decades. It’s also hardly surprising. From our own experience we can probably recall incidents of ourselves or others having extreme situations that become very expensive with large time periods and most people never having any major problems.
Because of this any healthcare market must  draw from a large number of healthy people to pay for a small number of very sick people at any given time. Bear in mind that 1% of people costing 30% is a unit in time. As you can imagine, when you get older your chances of entering that 1% become much greater. So possibly a 401k type health cost insurance system might make sense. That is, you may MORE when you are younger and “save up” for disaster in the future. 
Of course we could also let the top 1% and 5% die, reducing the costs massively, but this is not the kind of society we choose to live in.
So, we must design a market system that is built for the EDGE cases and not the MEDIAN cases because it’s the edge cases that are responsible for the large costs.
COMPLEXITY OF MARKET
When you buy a car there are things like truecar, cars.com, Car and Driver and so on to provide consumers with objective and comparable information when making a decision. There is no such tool for the healthcare market. Indeed, medical costs at hospitals are incredibly difficult to decipher.
First, things like “Asprin” can be called by many different names.
Brand names: Ecotrin, Bayer Aspirin, Acetylsalicylic Acid, Aspir 81
Second, the charges are separated from the underlying costs.

That is, on the hospital bill will appear “Ecotrin: 25$.” How can the average consumer possibly know they just spent 25$ on asprin? If you itemize 10 or 100 such things, it’s not reasonable to assume that any patient can possibly be educated enough to negotiate their bill.
LACK OF EMPOWERED DECISION MAKING AND BARGAINING POWER
The customer has no options at the point of use.
Both before and during hospitalization, you have very little time to make any kind of consumer based decision. If you’re in a car accident and unconscious, how can you possibly make sure the ambulance takes you to an “in network” hospital? When you are undergoing surgery, how can you possibly insure that your doctor takes your insurance, or what her rates are? Or if other hospitals and other doctors might offer the same services for less cost?
Also, let’s say you’re lying in bed and you are given a 25$ aspirin. Are you really in the position to ask how much the pill costs and then pop down to Walgreen’s and buy it yourself? Not really.
So when people suggest a more “open market” for healthcare, these factors are critical.
1% of the sickest people are unlikely to have sufficient bargaining power to influence the cost of their care. The other 99% are unlikely to be proactive and force providers to maintain reasonable prices.
Also, the providers themselves have to prepare for that 1% since that is where the costs are and if that is not somehow subsidized by the other 99%, it’s hard to imagine how they can bear those costs. Because of that their incentive is to gouge the hell out of the unlucky 1%, especially if they are uninsured as insurance companies have at least SOME amount of leverage to negotiate prices.
Medicare has one of the lowest reimbursement rates because it’s huge membership can help it exercise pricing power on health providers. A fragmented insurance marketplace doesn’t allow for that.
Part of the reason is because Medicare is not allowed to negotiate drug prices, whereas all other public health programs around the world can and do negotiate. Pharmaceutical companies resist allowing Medicare to negotiate claiming they need this in order to fund R&D, which is possibly true.
The question in my mind is why Americans are ok with subsidizing global pharmaceutical costs while not being ok with foreign imports; considering we spend much more on medication in our lifetime and can’t really do without drugs the same way we can do without TVs and smartphones. There must be SOME better way to fund R&D expenses than to have American citizens subsidize the costs of medications around the world.
SUMMARY
The nature of the healthcare market require us to design a system that is focused on outliers… not the average. It must also distribute those concentrated costs broadly. Finally, it must be regulated in some way to address the information gap and bargaining power gap between providers and users generated by the nature of the system (that is, when you need care is exactly when you are in the worst position to negotiate).


How to Pick your 401K Investment.

The 401k has essentially replaced pensions as the dominant way that people save for retirement. Regardless of whether you think that is good or bad it generally creates much more choices for employee investors. Few companies can or will give advice on fund selection and the companies who provide the system to the company may not have their interests aligned with employees.

So I tried to put together a fairly simple way to help pick.

WHAT TO AVOID

1) Avoid Return Chasing.
Probably one of the worst things you can do is filter by 3, 5 and 10 year returns and pick the one that has the highest return. It’s been proven over and over again that “past performance is no guarantee of future results. Actually in many cases the reverse is true. The better the past returns, the more people tend to pile in and thus the price of the investment has gone up a lot meaning that a normal “regression to the mean” will cause future performance to be worse.

Don’t get clever and try to buy the worst performing funds either because many funds disappear completely leaving the investor with $0.

2) Avoid Making things complex.
I think it’s wise to stick to 2-4 funds. Anything more gets really messy and complicated. You have to start thinking about which companies the funds hold and in what %, because there might be lots of investment overlap. You have to understand the different strategies used by the different fund managers. You have pay more attention to which indexes they compare themselves against. Additionally this generally has very little effect on long term overall performance of the investment, and it leads to “activity” by the investor that is almost always negative for returns.

3) Avoid looking at it too much.
In many situations monitoring and information are powerful tools. In investing they can be just as effective as blowing you up and giving you increased performance. Money has a huge impact on our emotions and losing it is really scary (I’m sure many of you are feeling that after “Brexit” last week). Those big moves up and down make us react in ways that are generally bad for our long term investment performance. The best advice I can have is to try to not look at your portfolio very often. Maybe a couple times a year or once a month at most; and decide in advance what you are going to do (or not do) and when you are going to do it.


WHAT TO DO

Let’s pretend we have 100k in our 401k with Fidelity, where should we put it?

1) Max any Matching
401k matching is free money. Of course ever article ever written about 401Ks says to do this. For some people it’s really hard because they are living on every dollar they earn. Still… if you can, cut things out of your budget… maybe that coffee in the morning or go out to eat less or whatever. If your employer has a match not only do you get double dollars, you also get them Tax free AND you get to avoid taxes on the compounding earnings over many decades (assuming you are younger).

A strategy I used when I was younger was upping it by 1% every 6 months to a year. A 1% pretax drop in my pay isn’t that noticeable, but over 3-4 years it increases contributions to 5%+ and that can have a HUGE impact over 30 years. It’s the boiling frog, but in this case it makes you richer instead of killing you :).

2) Define your risk tolerance and asset allocation.
This can be really tricky for people. Traditionally it comes down to stocks, bonds and cash. Since cash is elsewhere, the 401k really comes down to stocks and bonds. My suggesting is if you don’t know what your risk tolerance is and you are going crazy thinking about whether the market is high or low or if you should subtract your age from 120 and then set your % or if you’re a little older now, or if the bond market is overpriced. I’d keep it simple and just take 70/30 stocks/bonds and start from there.

3) Focus on fees.
When I look at which investments to make I use fees as the #1 filter. Here’s why.

Assume you have 100k in your 401k and assume that on average it will return 4% inflation adjusted a year for the next 30 years.

That initial 100k represents a “job” that “pays” you $4,000/year.

I think of fees as a “tax” on my INCOME as opposed to a cost on the PRINCIPAL. So when I evaluate fee impact I don’t do this:

100,000 * (1% fee) = 1000/year. “Wow. That’s only 1% of my money, that doesn’t seem like much.”

I do this
$4,000 income from job / $1,000 fee = 25%. “Hang on. The fund is taking 25% of my money? That seems really high.”

I’m convinced that second way is the way to evaluate ANY investment service that take a % of your money.


LET’S MAKE OUR CHOICES
So we have 70k to put in stocks and 30k to put in bonds, which ones?

STOCK SELECTION


So my first goal is to find the funds with the lowest fees.
Fidelity lets me do this pretty easily as I can browse the investment choices and show the fees in a nice list (they don’t let me sort by fees, so it’s a bit more work). Here’s what it looks like:

You can see that the first tab is annual returns, followed by cumulative total returns. That’s what most people use. I barely look at them because I consider them mostly noise.
I’m VERY interested in that gross expense ratio. The lowest one is the FID 500 Index PR at 0.07%. The highest one is the JPM Midcap Value IS at 0.94%. Now all of these fees are pretty decent as many go up to and above 2%; which in our 4% long term return world is 50% of our income. No way.
I honestly think 1.5%+ fees in 401Ks should be pretty much banned. In fact I think anything over 0.5% has no business being in a 401k because it’s just acting as a wealth transfer mechanism from the middle class to the wealthy institutional investors by capitalizing on people’s ignorance. 401k managers who recommend funds that charge 1%+ without major disclosures and resistence (either in person or via automation) should be ashamed of themselves. But that’s just my opinion.
Personally I omit all funds and ETFs that charge more than 0.5%. More generally, unless there is a really strong reason to the contrary, I won’t give anyone more than 0.5% of my investment, period.
In my situation it limits me to a handful of choices. There’s a midcap index, a smallcap index, an international fund, etc. What I would normally look for is some kind of global fund (Vanguard has one called VT that is basically the world stock market in one fund). The other way to do it is to split it into “domestic” (for me the US) and International.
The best domestic option I have is the FID 500 INDEX PR (FUSVX) which basically tries to duplicate the behavior of the S&P 500.
Most people know that VERY few professional investors beat the S&P 500 over time so that combined with the small fees makes it by far the best choice open to me.
For international the best choice is FID INTL INDEX PR (FSIVX) fund because it has a low fee of 0.17% and good diversification. It’s also NON-US which means there will be very little overlap with the FUSVX.
Personally I would put ALL of the 70% into the FUSVX because it’s by far the lowest fees for the diversification. Many people argue that the S&P isn’t well diversified because it’s all big US companies. That’s partially true, but many of those companies get much of their revenue from global sources so it’s far more diverse than it looks. It DOES focus on large companies, but I think the smaller the company and the more focused the investment the more you have to know to invest and this is about SIMPLE choices.
It would be totally reasonable for me to put half of the 75% in FUSVX and half into FSIVX. I just really hate fees and think the S&P 500 is pretty well diversified globally, so that’s what I would do and what I would recommend.
BOND SELECTION
Bond selection is not different. Fidelity doesn’t let me easily filter so I have to find the bond funds inside of that list.
The lowest fee is the FID US BOND IDX PR (FSITX) at 0.17%. Similarly there’s high yield bond funds, international bond funds, and so on, but since bond investments tend to be the more stable/less return part of the portfolio fees matter even more. FSITX is invested in US government and corporate bonds in a pretty “normal” way.
So I would put the full 30% there.
That means I’m omitting international bond exposure which can be argued is not diversified enough. Unfortunately, the best choice for me was the AB GLOBAL BOND Z,  but it’s fees are way higher (0.53%) and it’s 40% US Bonds anyway.
A NOTE ON TARGET DATE FUNDS
Fidelity (and most major 401k providers) have so-called “Target Date” funds which seek to adjust the risk structure based on a targeted date (usually for retirement).
So let’s say you pick FITWX which has a target date of 2025. As it gets closer to 2025 the fund will move more of it’s assets into “less risky” assets such as bonds and cash. It’s basically a well diversified, age adjusted and rebalanced portfolio all in one.
I think these are great, but I HATE the 0.55%-0.77% fees. Vanguard, for example, has a 2025 target date fund that has 0.15% expense ratio. I’m not going to pay 3.5 times more than I could for the privilege of having the word Fidelity on the fund. Sorry.
If the fidelity fund had a competitive fee, I’d just put everything in that and move on. I just can’t pay that 0.66% fee when there’s far cheaper and nearly as simple alternatives. So if your provider has a target date fund that has reasonable fees, I’d probably go with that; and if I roll my 401k over; I’d probably put it into a Vanguard target date fund that matches my expected retirement date.
SUMMARY
So there you have it. 2 investments, simple choices, fairly broad diversification, low stress.
Of course WHAT the market returns I can neither control or predict.
I can control fees so I monitor them and adjust as needed (hasn’t been needed in last 4 years).
I can control spending (to some extent) and thus I can max the matching.
I can control taxes (to some extent) and thus reduce my income liability by saving more in my 401k.
Hope this is helpful!

Simple Visualization of Household Income Distribution by Quintile Over Time

I’ve been commenting and thinking about income, unemployment and social effects for a while now, but I had a really hard time finding a nice, simple multi-decade view of household income distribution.

It turns out this is easy to do. The data is readily available here and it goes back to 1967 based on census data… so it’s about as “objective” and consistent as you can get.

APPROACH
My approach is brain dead simple. I take the mean household income by quintile, add up the total and then divide each quintile by the total to get a % of the “pie” that quintile earned. Then I divide each % by the previous year’s % to get the delta from year to year. That should give a somewhat clear picture of how households in different brackets are doing comparatively over time.

I’ll put the table details below.

VISUALIZATION
I used a waterfall chart because I think it does the best job of showing the change over time.

NOTE: The first bar is the delta from 1967-1970 and the second bar is from 1970-2005. Then it becomes annual. I’m doing this on purpose to show the long term change as well as visualizing the last recovery between 2008 and 2014 (I couldn’t find 2015 data).

So here it is by quintile:

INTERPRETATION
We must be honest with ourselves that without knowing the size of each group we can’t know the total impact, but I am going to assume that the highest quintile did not grow meaningfully in % of total population.

So given that assumption, since 1970 every other quintile has had a meaningful decline in income (as a percent of total income to all quintiles) with the worst drop hitting the 2nd quintile.

Additionally, since the great recession only the top quintile has had a gain in income so that pretty much explain why the perception of most people is there hasn’t been a recovery. If your paycheck goes down or stays the same… you don’t feel like anything is recovering.

Now WHY this is happening is playing itself out in lots of political and social debates. I’ll save that for a different day.

In any case it helped me understand how the country as a whole can be wealthier but the majority of the people in it can feel poorer.

RAW DATA TABLE
If you want the actual excel file, email me.

How rich people get richer and why inheritence is anti-capitalistic.

THE STORY OF PAUL AND PAULA
There are two young people at the beginning of their careers: Paul and Paula.

Both finished school with no debt, live within their means and have identical spending and saving habits. Both have annual income of $100,000 (I know, it’s high, but it’s easy to do math on 100 vs 55 so bear with me).

Paul and Paula are quantum entangled and as such over the next 40 years they both experienced exactly the same things: they married at the same time, had children at the same time, endured identical medical problems, and had duplicated investment returns. In short everything was exactly the same, except one thing…

Paula derives her income from work, whereas Paul derives his income from a trust fund.

We’re ignoring, for a moment, the implications of this difference… more time, less stress, access to health insurance, 401ks, and on and on. We’re going to pretend that all of that is equal although I would contend that the inherited income has far more financial benefits than the earned income.


WHAT HAPPENS – THE MICROCOSM
It’s April 10th.

Paul and Paula are both procrastinators and so they are scrambling to do their taxes.

Both have fairly simple taxes at this stage in their lives. They are single, have no children, and do not own a home. They also live in a state with no income taxes and so their procrastination will not be a major source of trouble.

Paula has a W2 from her employer but no other sources of income. Paul has his investment income but no other source of income.

Let’s see how their taxes compare.

With no other deductions, sources of income or write offs, Paula will pay $18,553 of taxes… roughly 18.5%.

Paul on the other hand will pay roughly, $7,979 on his $100,000 of qualified dividends.

Now, I KNOW that of course it’s never this simple; but bear with me.

In terms of monthly cash flow, Paula has $6,787.25 whereas Paul has $7,668.


HOW DOES THIS IMPACT SAVINGS?

Continuing the story, let’s look at two scenarios.

In Scenario 1, both save 30% of their post tax income and adjust their cost of living appropriately.
In Scenario 2, both have the same cost of living, $4000/mo, and save what’s left over.

Here’s how that looks:

This demonstrates two things.

1) How big of a difference in savings it makes if you save a large % of your income and then adjust your cost of living.
2) A lower tax based due to source of income has a dramatic impact on savings rate if lifestyle is equal.

In other words, if your source of income is from an inheritance, you can have a much higher savings rate while maintaining the same quality of life as someone who has to earn their income via a W2 based job.


HOW THIS GROWS OVER TIME

I’m sure everyone understands the basic concept of compound interest, but it’s always fun to visualize.

So let’s say both Paul and Paula are going to work for 40 years, invest their money in a boring 70/30 stock/bond index fund (insert pitch for vanguard here) and they had a reasonably modest 4% inflation adjusted return over that time period. After that 40 years they both plan to retire.

How did that turn out for them?

Here’s a chart showing annual savings as well as accumulated net worth based on the fixed $4,000 monthly spend scenario:

PAULA’S DATA
PAUL’S DATA

Paula’s accumulated savings are $3.17 million whereas Paul’s are $4.18 million, just under 25% more.

POST RETIREMENT LIFE
So now they’ve retired. Paula has a very respectable $3.17 million saved and Paul has a somewhat larger $4.18 million saved.
Both of these are incredibly good scenarios and well beyond what most people end up with after 40 years of work which shows how important the forces of consistent savings and avoiding bad luck are.
That said, let’s assume both Paul and Paula believe in the 4% rule and start withdrawing 4% of their savings over the next 25 years. They also will continue to get a return on their savings of 5% per year.
Since they are connected through some bizzaro human quantum entanglement they will die on precisely the same day 25 years after they both retire from work.
At the end of those 25 years, Paula’s assets are $3.88 million and Paul’s are $5.06 million… quite a bit more.
Additionally, Paul spent a total of $4.61 million (164k/year on average) while Paula spent “just” $3.5 million (140k/year on average).
That means that when they die, in addition to having significantly more to spend during his retirement and not needing to have income from a job, Paul ALSO gets to leave considerably more to his heirs.
BUT WAIT THERE’S MORE
Consider… we didn’t even include Paul’s initial trust of a few million to provide him with the 100k income over those 40 years of work.
Let’s pretend that his trust did just well enough to pay him 100k/year, matching Paula’s income, but nothing more. Applying the 4% rule in reverse, we’ll assume that this amount was $2.5 million (100,000 / 4%)..
Let’s further assume that Paul gets the $2.5 million from his trust fund the day he retires, and we add it to his day 1 retirement pool of.$4.1 million.
How do things look during and after Paul’s retirement?
In a word, not bad. Paul now has $8.09 million at the end of 25 years of retirement while also being able to spend $7.35 million (an average of 294K/ year).

That means in addition to spending more than double what Paula spends in retirement, he will also have two and a half times more money to leave his heirs.

Not a bad deal for being born lucky.

CONCLUSION

If you inherit enough money that it pays you investment income that is similar to a full time job, you get MASSIVE benefits… like my dad said it’s like playing monopoly with twice the starting money and 4 dice instead of 2.

Now I’m not saying that investment income should be taxed like regular income, because I understand that within a single lifetime that amounts to double taxation and would be a pretty brutal (and I think unfair) hit on retirees. That said, I do believe that inherited wealth is somewhat different. Specifically I think the “luck” factor in inheritance is significantly higher than the “luck” factor in saving diligently, having a successful business, etc.

Additionally, if you multiply this effect over generations it’s obvious that it acts to concentrate massive amounts of wealth in the hands of a few people. Those people will not be able to spend the money efficiently in order to ensure the economy keeps moving, technology improves, innovation is spurred etc. Instead they are likely to hoard and stagnate the flow of capital. That is VERY bad for capitalism and society.

I don’t have a single, simple solution, but I do think that society needs a fairly comprehensive way of preventing those things from happening. One way, of course, is to have an incredibly “progressive” estate tax, which is what Bernie Sanders is suggesting. Assuming that it isn’t “game-able” by extremely wealthy people… and that’s a big assumption… that would either redistribute their wealth more evenly or encourage them to use it/give it away before they die.

I personally LOVE “The giving pledge” and think it should be extended to include people other than billionaires.

It does bring up the challenge of trying to decide who/how the money should be distributed, but I think almost any system is better than the ovarian lottery.

Do Rich People Really Pay Less Taxes?

WARNING: INFLAMMATORY CONTENT AHEAD!
My reason for interest in this topic is primarily driven by the impact taxes have on most people of the world as well as the confidence that individuals have in taking any extreme position on the topic.
Just as random sample , here are some claims of the “rich paying more” position:
And here’s some saying the opposite:

I’ll let you google it yourself. It’s easy to come up with very confident and authoritive articles that will support whatever you want to believe.
So there you go… case closed. The rich and poor both pay more than the rich and poor…
…and that is actually true.
You would think that since taxes are fairly objective… that is to say, reported collected taxes is an objective measure, reported income is an objective measure; this should not be a controversial topic.

But it’s not.

INTERPRETATION, ANALYSIS, INCENTIVES AND THE DATA ECHO CHAMBER
I think the primary reason for this is that most people are not really interested in whether or not the poor or the rich pay “too much” or “too little;” they are interested in affirming their bias. So I created a little matrix to represent this across two simple dimensions:
Ok, over simplified, but basically this breaks people into self-identified buckets that influences their perception and informs how they look for information. If you are rich and you feel “justified” about it, I suspect you will tend to find information that makes your tax situation seem unfair towards the “I pay too much” side, implying others pay too little. Conversely, if you feel “rich/unjustified” then the reverse is true. The situation if you are “poor” is not very different, although I suspect the # of people who deliberately fall into the “poor/justified” bucket might be small… I also think that the # of people who subconsciously feel this way might be pretty big; that is to say people who are poor and feel that they somehow deserve it.
So how does this play out? Well, if you’re rich and feel you “deserve it” you might type into Google “do the rich pay too many taxes” and boom… tons of support. If you are rich and “don’t deserve it” you type in “do the rich not pay enough taxes” and boom… tons of support for that too. Since the way search engines work is they echo what is sought after and avoid contrary positions; this can easily lead each side to believe they are objective and everyone agrees with them… cause… well… the data says so. How many people actually try to search for the opposite of what they believe and then compare the differences to check against their biases. That sounds hard!
And of course there is plenty of data to back up any position. For example, in terms of “total federal income tax collected by income bracket” the richer groups pay more in total receipts. That gives you graphs like this:
Wow. That’s pretty convincing. I mean, look… rich people used to pay just over half… now they pay over 3/4 of the taxes! Case Closed!!
But wait… something critical is missing… how was the total income earned distributed over that time period. Well, that question creates graphs like this:
Aha! Now we’re getting somewhere. Those rich bastards have almost tripled their income, while their tax contribution has only gone up 20%. CLEARLY the poor are paying way too much.
Hmm… well maybe.
But hang on a second there professor… is it that the rich people got way richer at the EXPENSE of the poor, or was it that the subsequent fifths should have gotten richer as well but because of other things (that have nothing to do with taxes) they didn’t? Maybe there’s not enough welfare? Or maybe wage policy was bad? Or maybe it was all that outsourcing and we just haven’t figured out how to outsource Investment Bankers and CEOs… yet!
CORPORATE BASTARDS – I KNEW IT!
Next up, we can look at the SOURCES of tax revenue over time which makes charts like this one:
Aha! It’s those bastard evil corporations that are using their huge might to suck up all the money for themselves. No doubt they are filtering that revenue to those upper 1% earners as well. Now it all makes sense…
Well… maybe.
But maybe… as companies globalized their sources of profit got broadly distributed to other countries… other countries where they owe taxes to THOSE governments. Consider things like companies trying to repatriate money or moving their corporate headquarters to countries with friendlier tax laws.
Back in the 1960s and 1970s the US was much more of a self-consuming market. So it just isn’t this simple… During that same time the US’ trade deficit has also exploded. Well… it turns out when you import most of what you consume; your corporations aren’t paying taxes on the development, manufacturing and distribution. And if they can figure out a way to make that stuff cheaper AND pay less taxes… it makes sense that they will try and do that, right?
Let’s be honest, all those iPhones and iPads are not being made over in Cupertino. At least not right now.
As much as we want this to be a simple problem… it isn’t. And that makes it so that anyone with an axe to grind can make the picture look however they like.
LET’S LOOK A BIT DEEPER
So, what’s really going on here?
Something that became very clear to me is that regardless of their position on the topic, people had a very similar approach to taxes.
We see taxes are a weapon that you use AGAINST the “other” group as opposed to a neutral mechanism that helps distribute large but necessary public costs as equitably as possible across the population.
Very few articles talk about taxes as a process by which we fund important things like: infrastructure, defense, education, health, etc. Instead it’s almost always either:
a) a platform to complain about how someone else has it better than me or has something they don’t deserve
b) a platform for complaining about how a political party or individual I disagree with is an idiot
One thing that people seem to be unified on… OTHER people don’t pay enough taxes whereas I, of course, pay too much.
That is… the system is unfair:
..and there is definitely a relationship between how much you pay (in absolute terms) and how unfair you think it is.
This is pretty unhealthy, in my opinion, and what is at stake is our ability to create a functioning society.
Personally I don’t see taxes as bad or good, nor do I see them as a weapon that should be used in class warfare. There are plenty of other class warfare weapons that are perfectly legitimate and probably more effective: minimum wage, employment laws, social security limitations and payouts, welfare reform, and so on. And those are equally fun to debate!
CONCLUSION
I think when we think and talk about taxes we should try to look at it from two perspectives:
1) Which programs/projects/institutions benefit from public ownership and support and which don’t.
2) How can we distribute the costs of those programs/projects/institutions in such a way that the wealth of the payer is proportionate to the cost they bear.
That means we need much more debate and transparency around what (1) actually is. I suggest an itemized list of public projects/programs/institutions, their associated cost and each person’s “share” of that bill. So basically I know that when the DOD buys a stealth bomber, I paid $4.89 for it, and I can then look at where I spent my money and decide where I think it makes sense and use that to inform my voting behavior.
Maybe I think that an extra Grade Vanilla Latte would have been much better than a stealth bomber… or maybe I’d be willing to forego that extra 24 pack of diet soda so that we can fix some of the crumbling bridges. Ultimately those are the decisions that we are making, but they are so buried that we don’t think about it this way.
In this way we can see taxes as a way to get maximum benefit from public contribution to important projects that we all need as opposed to this evil institution that is just sucking up all our money and giving it to others far less deserving than ourselves.